|
|
 |
The LACES Project
Large Atmospheric Computation on the Earth Simulator
Canadian meteorological scientists that need to achieve very
high-resolution simulation of severe weather precipitation systems seek
high performance computer resource outside the country. To carry out a
full life cycle convective scale simulation of Hurricane Earl (1998)
which transitioned into an extra-tropical system with heavy
precipitation affecting the Canadian Maritime Provinces a Canadian team
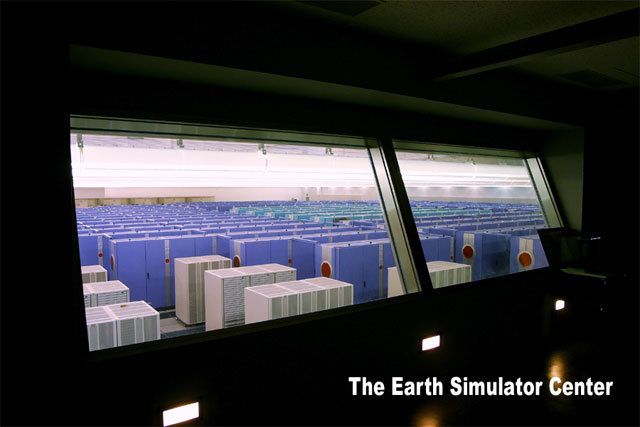
has used the world’s fastest computer, the Earth Simulator (ES)
in Japan that ranks first on the TOP-500 list.
The team was comprised of Dr. Brunet and Desgagné
(RPN/MSC), and Profs. Yau and Gyakum (McGill U.) and Dr. Ohfuchi (ESC). The project was
supported by the Canadian Foundation for Climate and Atmospheric Sciences.
The Canadian MC2 model has achieved 10 TeraFlop/sec on an 11000 x
8640km domain with 50 vertical levels that covers North America and
North Atlantic, see the document "Annual Report of the Earth Simulator Center" for a
summary of the ES activities, and the document "Large Atmospheric Computation on the Earth Simulator :
A report on the LACES project" for details. This outstanding
performance was attained with approximately 4000 vector processors on
500 nodes. This is 25 times more than we can achieve on the new
Meteorological Service of Canada IBM cluster that ranks 54 on the
TOP-500 list.
The following animation shows 60 hours (prog 12H to 72H valid
September 1 06 UTC to September 3 18 UTC) of the simulated specific
humidity at 325m. The horizontal domain of this animation covers
roughly 3% of the total computational domain and is focused on a 2160 x
1440 km sub-domain over the Gulf of Mexico. Model data from the 1 km
horizontal resolution has been properly average to produce this 720x480
avi format. The simulation shows realistic instabilities and sheared
disturbances evolving around the spinning hurricane.

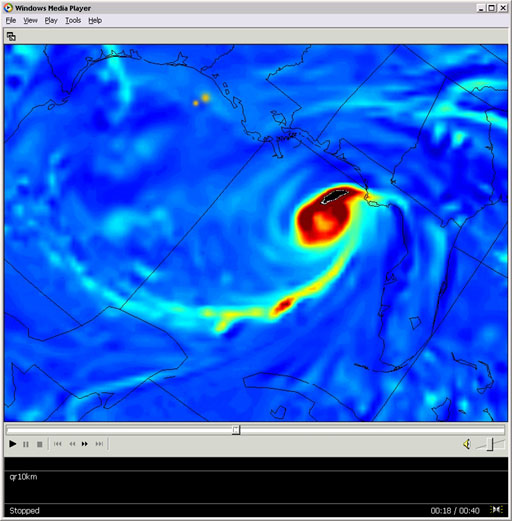
The following simulation shows the first 72 hours of the 10 km
resolution simulated relative vorticity (altitude 950 hPa), September
1-3, 1998.
The following animation shows the full 165 hours of the 10 km
resolution simulated relative vorticity at 950 hPa, valid August 31, 15
UTC to September 7, 12 UTC, 1998.
The animations are copyrighted : "Copyright
(c) Recherche en Prévision Numérique, Meteorological
Service of Canada under corporation among Michel Desgagné,
Gilbert Brunet, Michel Valin, Wataru Ohfuchi, Peter Yau, John Gyakum,
Hiroshi Niino, Yuki Fukurawa and Ron McTaggart-Cowan" .
| URL of this
page : |
|
| http://collaboration.cmc.ec.gc.ca/science/rpn/laces/en/index.html |
| Created :
2004-10-04 |
Modified
: 2005-06-27 |
This is the Green LaneTM, Environment
Canada's World Wide Web Site.
|