
|

|
|
|
|
|
||||||||||||||||||||||||||||||||||||
|
|
 |
For a full size copy of the figure, click on it. You can also download it that way (53 kB). See further below for extensive data related to this map. |
Note that this figure (or its equivalent) has been published
This new map illustrates a step beyond the previous standard knowledge published in 1992 by Environment Canada as ARD-92-003 report (J. Walmsley and R. Morris). That previous map was much coarser in space and based only on wind reports from surface stations. Note that its contours are windspeed values, not WE. One can see on it the large low-wind region over the Canadian shield, curving around Hudson Bay, similar to our Level 0 map above
 |
Click on image for a full-scale version. |
Our new project, using the WEST system , aims at advancing yet another large step beyond what has just been deduced from the CMC forecast archive of the past 5 years.
CAVEAT about the large WE values over open waters. The large values of WE obtained by the model over the Atlantic and the Pacific are correct by themselves, in the sense that one should be able to verify them against for instance buoys data or ship data. They are dependent on the formulation of boundary layer turbulence used in the NWP model. One can read further about that in the references. Also, there has been several case studies based on this model for marine storms which support these values. One should be note that the WE goes as the cube of the windspeed, which tends to overemphasize the land-sea contrast of the wind.
Finally, and most important, due to the coarseness of the model grid, i.e. 25-km horizontal spacing, one has to realize that the first cell which is truly over water or off-model-shore is at least 25 km away from the geographical coastline: in other words, 100 % out-of-bond for the current offshore wind farm building techniques. This is demonstrated by the following image, where the MODEL COASTLINE is displayed (as a white line) instead of the usual geographical coastline, and where the WE values (shown in colour) outside the MODEL COASTLINE are masked off. One can see enhanced WE on some coastal lands, expectedly. Obvious in the image is the model-transformation of important coastal insular landmarks (eg Vancouver Island, Anticosti and Prince Edward Islands, Newfoundland) into peninsulas.
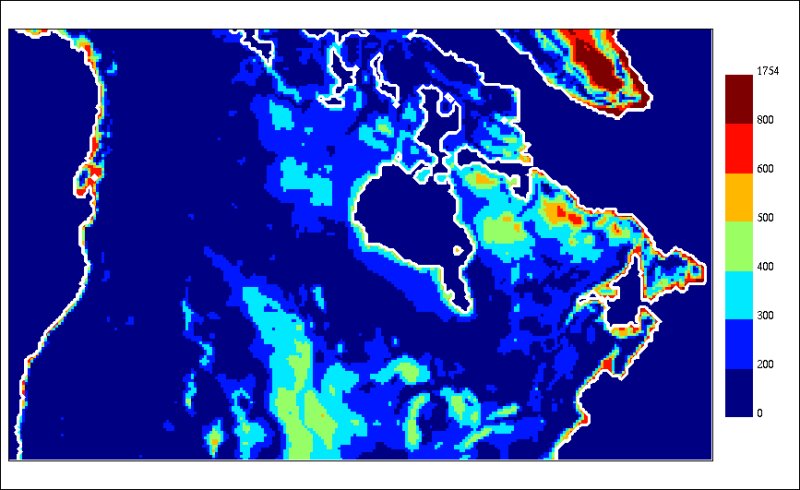 |
Thus, the marine values of WE produced by the Level 0 Atlas are NOT to be used as guidance for offshore projects.
The methodology applied to compute the Level 0 Atlas can be summarized as: downward extrapolation of the predicted airflow from the archived isobaric (constant-pressure) levels to a fixed elevation (50 m, turbine hub-height) above model topography. The lower model levels in the CMC archive are at 100, 92.5, 85, 70 hPa. For further details, click here.
The accessible dataset (click on the above link) includes GIS-ready files and digital maps for: